


Why The VIX Says This Is The Time To Buy, Not Sell!
If you're willing to be a contrarian, the opportunity for above average returns has arrived.


If you’re like a lot of investors who have watched U.S. stocks fall precipitously over the past two weeks, you might be feeling a little queasy. At one point, the S&P 500 was down more than 10% from its all-time high. The Nasdaq 100 was down more than 14%. The Russell 2000 nearly touched down 20%. It’s uncomfortable to watch, no doubt about it.
We got spoiled by 2021 though. Only one 5% pullback the entire year and even that was over in a few weeks? That’s not normal. What’s happening now is normal. Maybe not the sharpness of the decline, but stocks declining 10%, 20%, even more is not unusual. This is par for the course when it comes to investing in risk assets. This isn’t fun to experience by any means, but it’s not unusual.
In fact, you may have just been presented with an opportunity.
Back in 2020, I co-authored a research paper with Michael Gayed of the Lead-Lag Report where we examined using the VIX as a buy/sell signal to see if and at what levels it might allow investors to generate above average returns over time. The answer is yes, and the paper went on to win the NAAIM Founders Award that year for outstanding investment research.
The concept behind the paper is a variation on the traditional buy low/sell high idea. The VIX tends to spike during market declines and remain low during periods of calm rising markets. Our theory was that if you invest when the VIX spikes, you’re essentially buying low. If you hold and only sell when the VIX breaches a certain floor, you’d be selling high.
The research proved that theory to be true (historically at least). You can see in the table below the 500 trading day forward returns by sector based on the VIX level at the time.

The trend here is pretty clear. The higher the VIX is when you invest, the higher the forward-looking returns have been. The greatest returns, not surprisingly, come from cyclical and growth sectors. The converse is also true. Some of the lowest forward-looking returns came when the markets were at their calmest. That’s not to say that an old fashioned buy-and-hold strategy is a bad idea, but there are opportunities to exploit the markets if you’re willing to swim against the tide and be a buyer when the herd is probably selling.
So what’s the ideal VIX level to begin buying? Our research indicated that the optimal returns (again, historically at least) were achieved when the VIX moved above 33. On the other end, it’s time to sell if the VIX moves below 12.
I point this out because the VIX just moved above the 33 mark for just the 2nd time in roughly the last year.

You can see that the opportunities to invest when the VIX is above 33 are few and far between, but we’re at one right now. As you can see, just because the VIX moves above 33 doesn’t mean it can’t go higher. It’s not necessarily an indication of a bottom either, but it does put you in a much better position to capture above average gains moving forward. It does require a bit of a strong stomach and a willingness to zig when most other investors are zagging. You’ll be something of an outsider in your thinking, but the research has shown that you could be the winner in the end.
Some quick thoughts on the market right now…
The markets had been moving from growth into value for several weeks as interest rates were rising in anticipation of the Fed hiking later this year. Now, it’s looking more like a pure sell-off. Large-caps are down around 7% since the beginning of last week. Small-caps have done worse as have tech and high beta stocks. All of the defensive asset classes - utilities, consumer staples, Treasuries and gold - have either outperformed or generated gains.
The reason for this, in my opinion, is the fear that the Fed is hiking aggressively at precisely the wrong time and could sink the U.S. economy back into recession. GDP growth estimates for 2022 are already being revised downward. Inflation is at or near peak. The Fed tightening monetary policy conditions at a time when the economy is maturing and slowing is the opposite of what you want to see happening.
The biggest tell could be TIPS yields. The Fed has bought virtually the entire TIPS market over the past year and a half, so it may not be the most independent indicator, but it is showing that breakeven rates, or expectations for future inflation rates, are coming down. The markets are beginning to price in fewer inflation concerns and giving more weight to the idea of deflationary pressures building.
The Fed meeting this week could produce some insight into the central bank’s latest thinking given the market’s reaction over the past several weeks to the idea of overtightening. In the past, the Fed has pivoted to changes in the financial markets. Let’s see if they manage to hang on to their hawkish rhetorical this time around.
With that being said, let’s look at the markets and some ETFs.
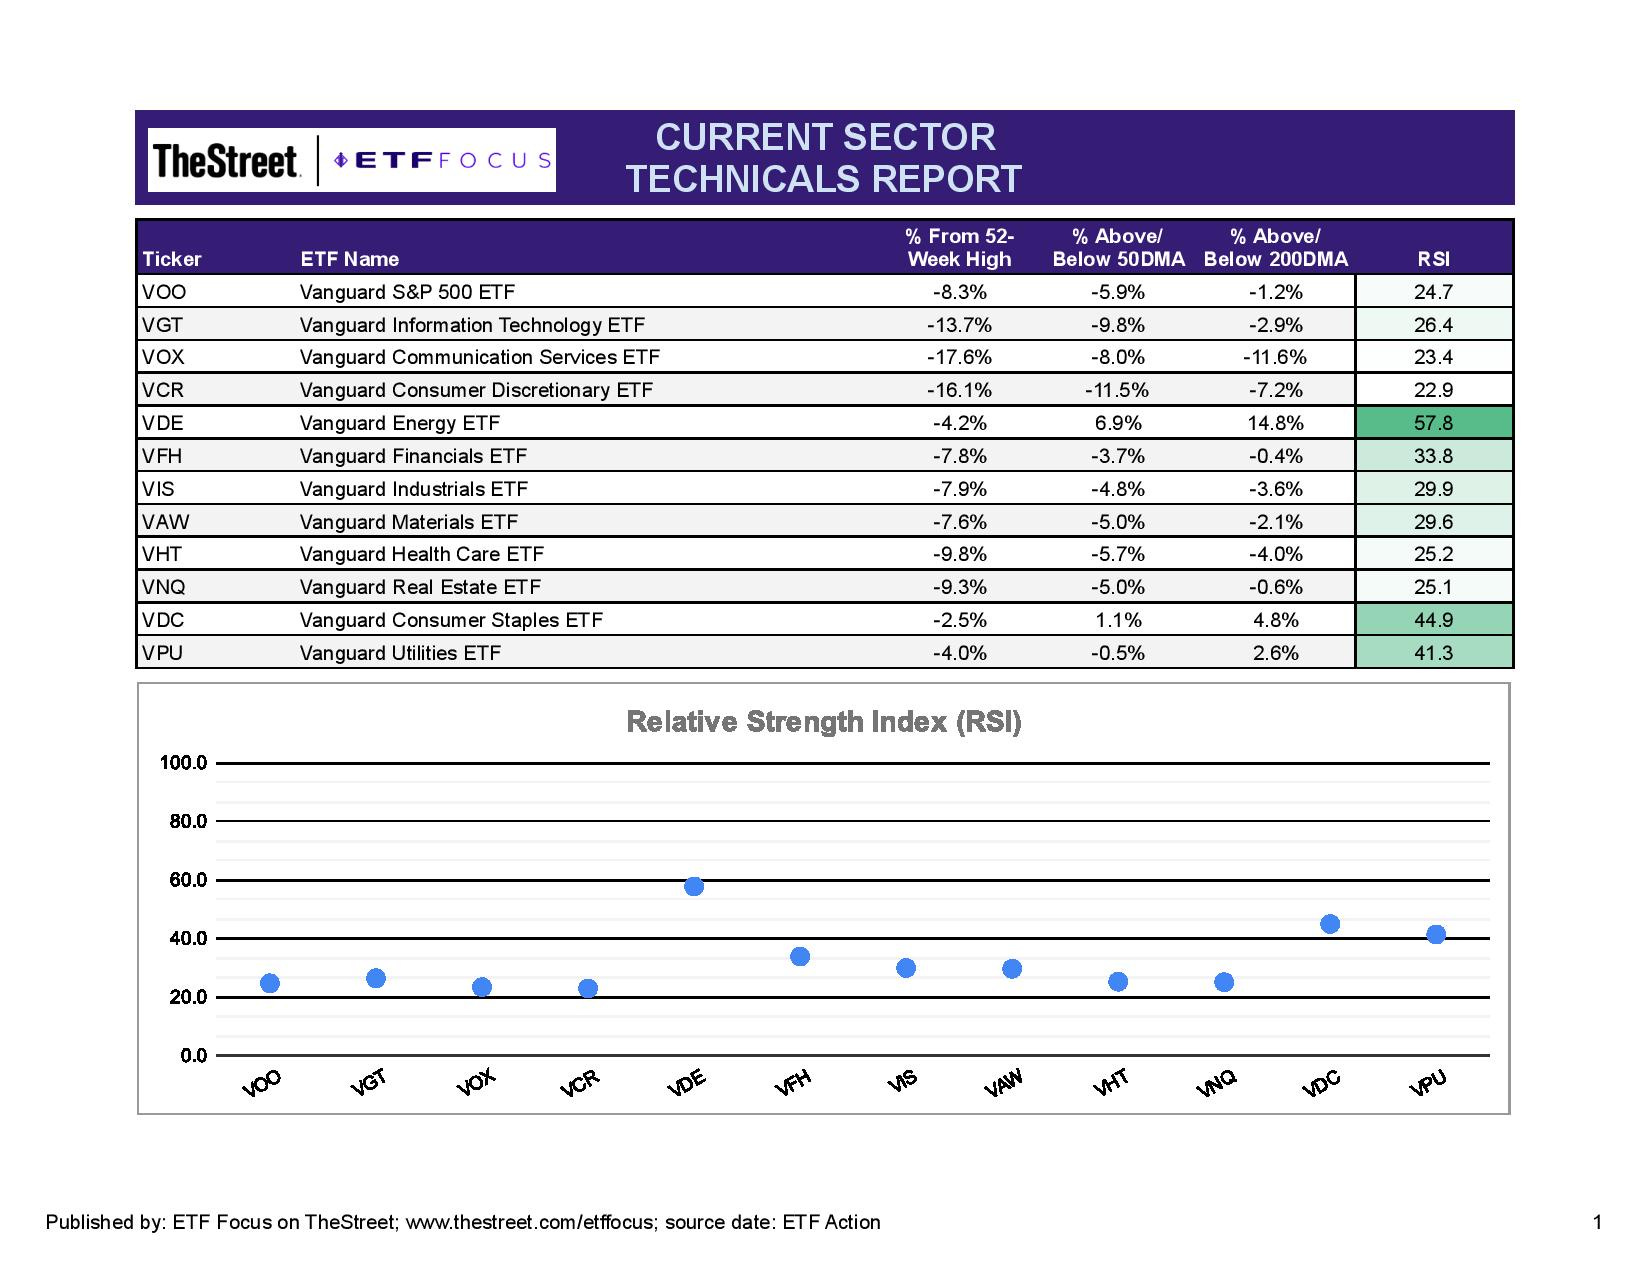
Not surprisingly, there’s weakness almost everywhere. The energy sector is the only sector showing any semblance of short-term relative strength, but even that is starting to break down. Utilities and consumer staples are outperforming as would be expected in a broad market decline, but even that pair is in a firm downtrend.
More importantly, especially if you’re a signal trader, is the fact that the S&P 500 closed below its 200-day moving average for the first time in a year and a half. The Nasdaq, the Russell 2000 and 8 of the major GICS sectors are also trading below theirs. As I see it, sentiment is about as negative as it’s been since the worst of the COVID recession. Does that mean this is a bottom? Hard to say, but it wouldn’t be surprising to see stocks rebound a bit here. Monday’s trading saw a sharp rebound off of the lunchtime lows, so perhaps there are some bargain seekers here looking to get back in. With volatility high right now, the range of possible outcomes this week is wide.
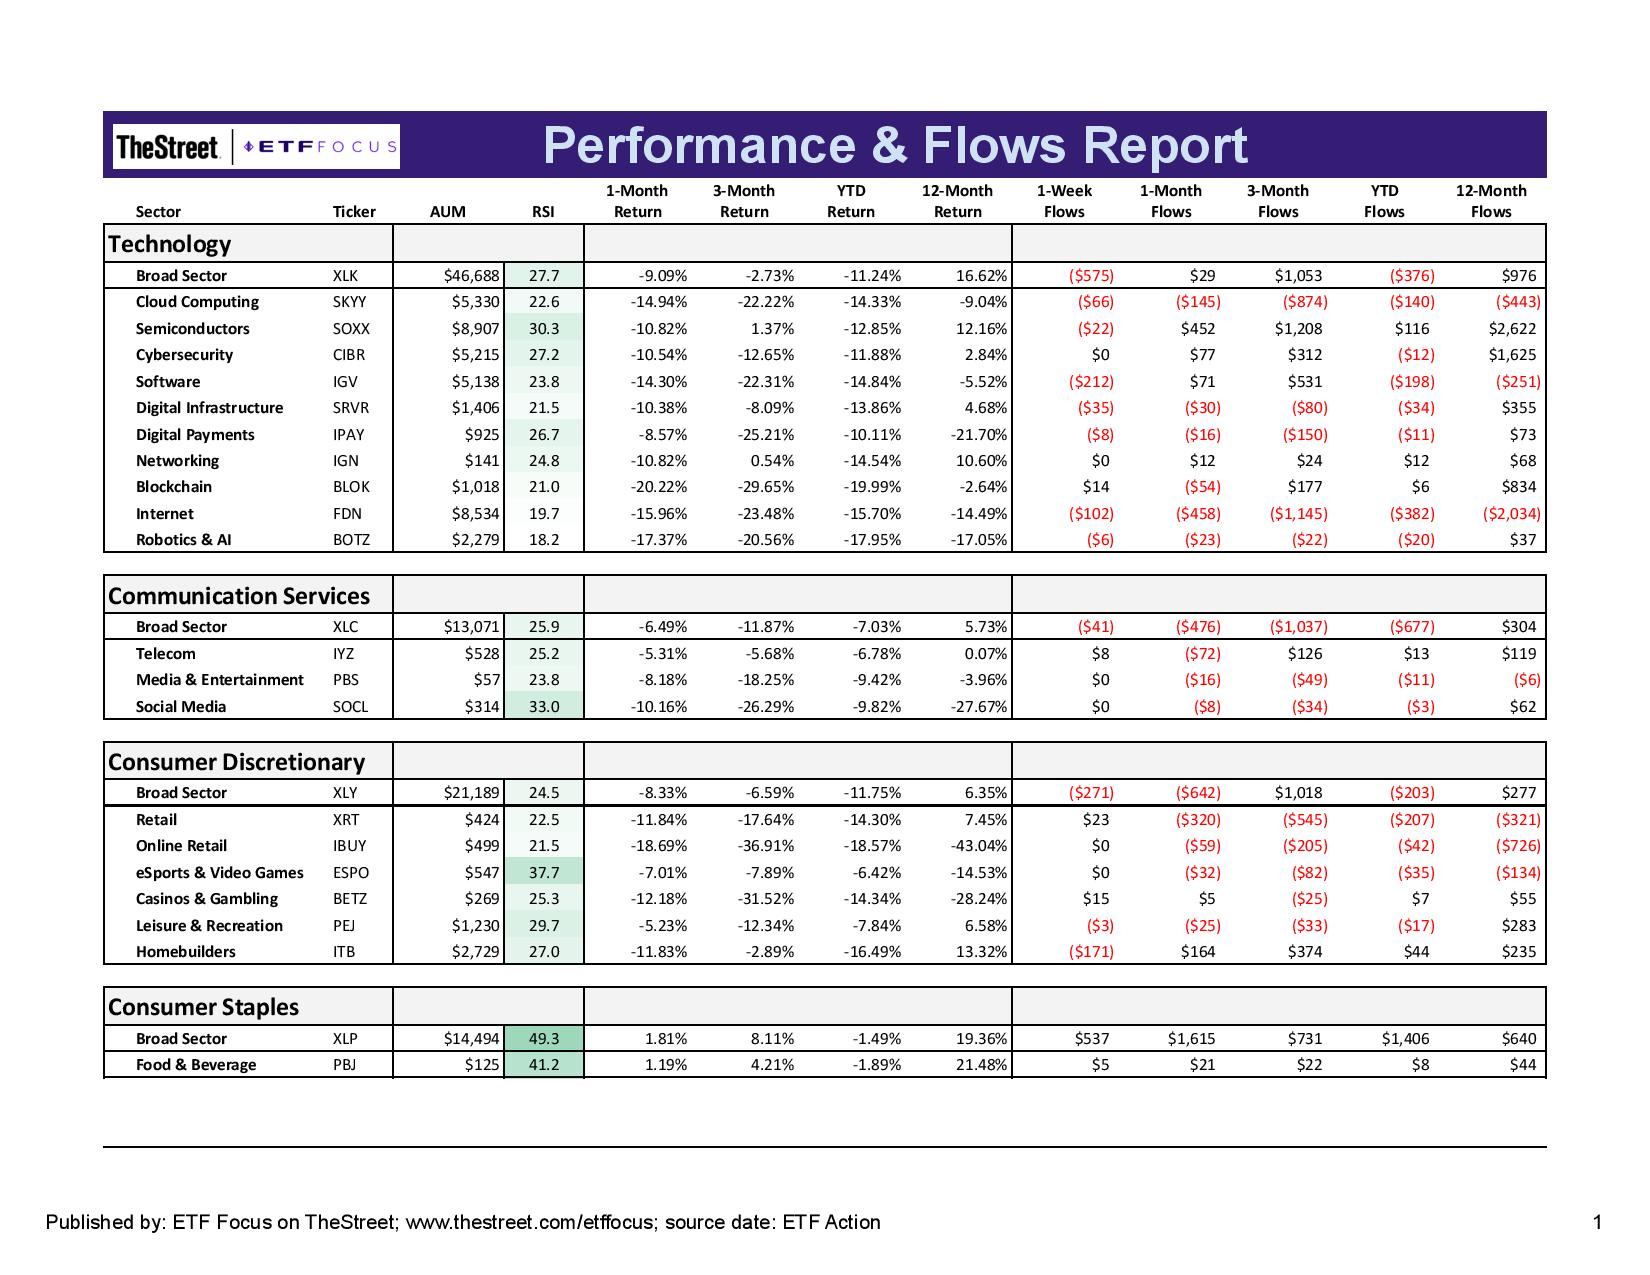
Tech is just a massive sea of red across the board. Every subsector has lost at least 10% year-to-date with more than half down by at least 14%. Even investor favorites, such as semiconductors and blockchain stocks, haven’t been immune to the damage. Tech ETFs have seen more than $1 billion in outflows over the past week. That may seem like a lot, but it’s still less than 1% of the total assets in these funds.
Its growth peers haven’t performed much better. Almost every subgroup here is also in oversold territory, which could support the idea of rebound off of these levels. Telecom stocks are also in oversold territory, but they haven’t performed nearly as poorly as the Netflixs of the sector. Names, such as Verizon and AT&T, are providing some support here, but it’s mostly red across the board.
Staples are the best-performing sector over the past several weeks and are starting to see the inflows following after the 8% gain over the past three months.
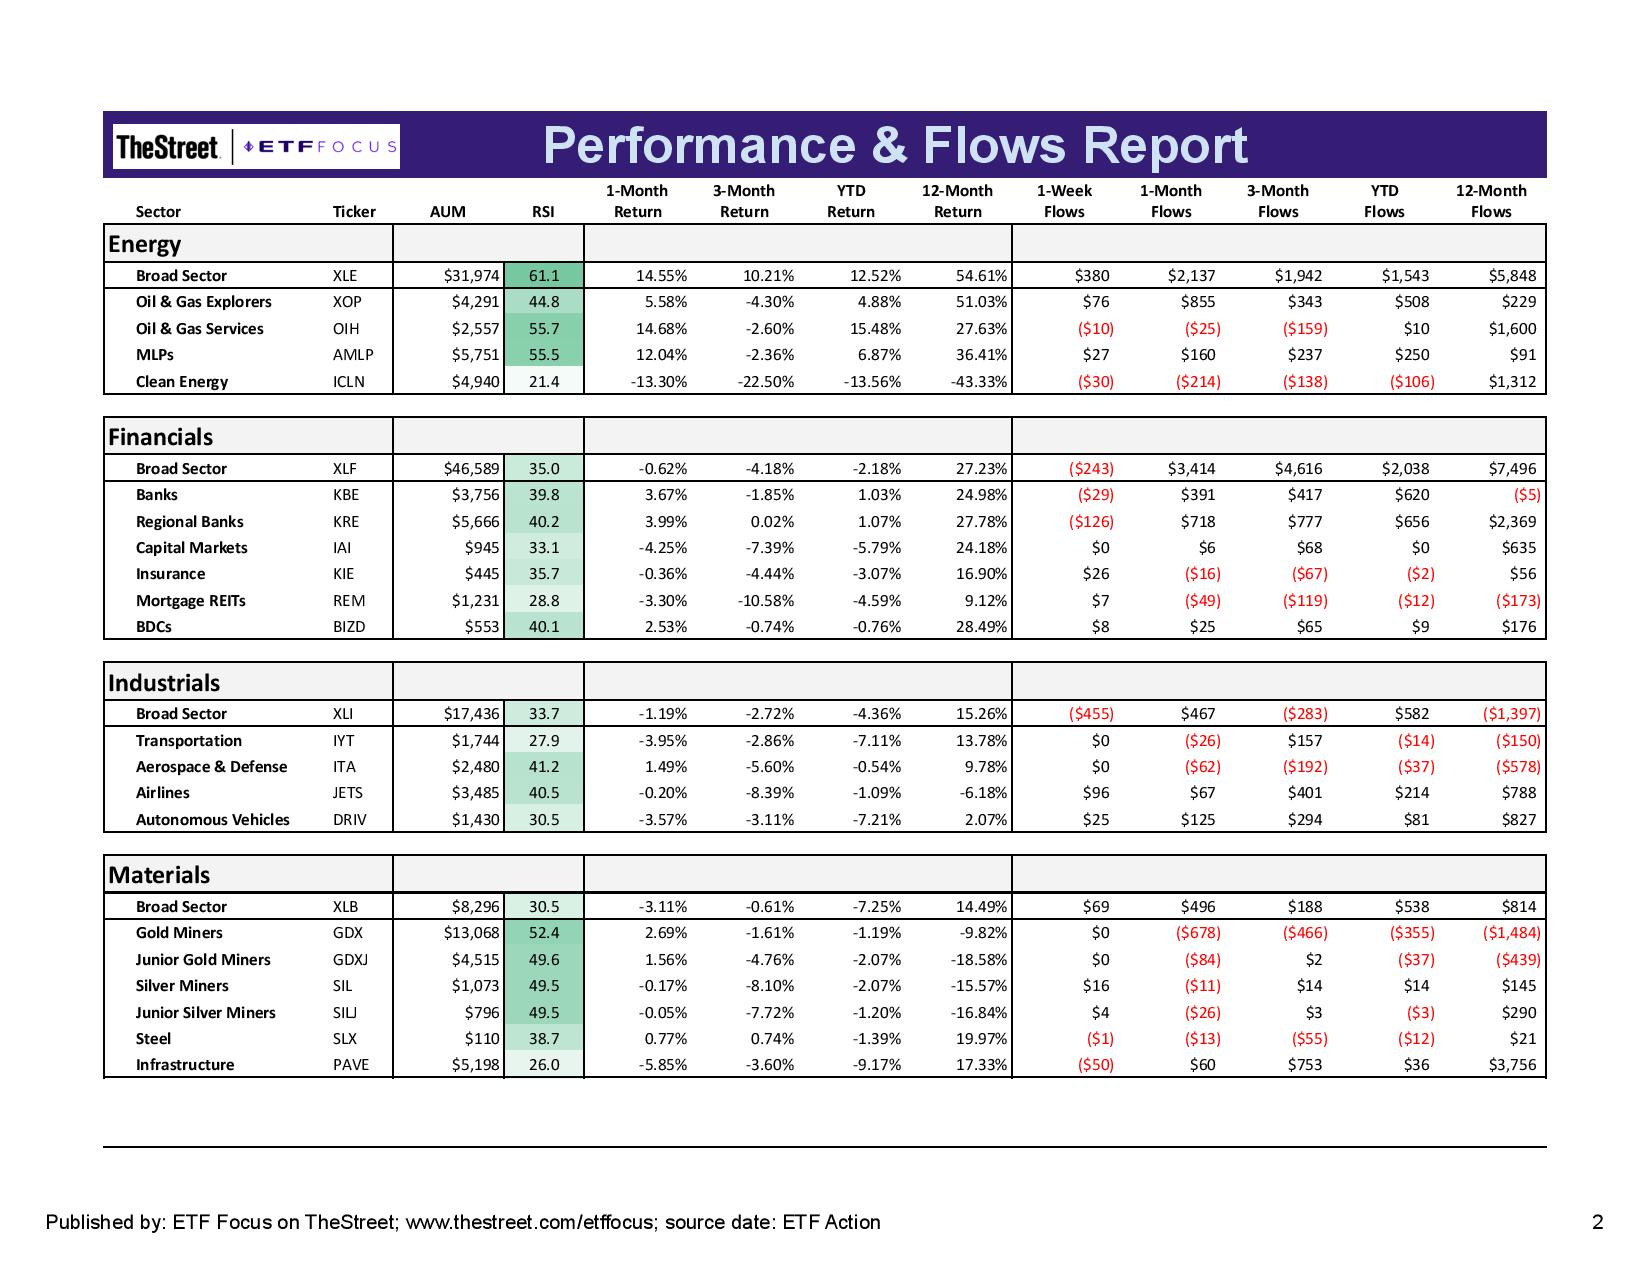
Energy remains the one sector with perhaps the best short-term relative strength, but even that has begun to break down. It’s only matched the market’s performance over the past week and a half, but that could also be considered a good thing since this group has frequently been a big loser during these types of market corrections. Both financials and energy ETFs have drawn big investor money over the past month at the expense of tech and growth ETFs.
The materials sector is holding up relatively well here on the recent strength from the precious metals miners. Gold, in particular, has shown little ability to generate any kind of positive momentum even though inflation is high and equity sentiment is terrible. Gold and silver miners are somewhat behaving as a safety play, but it’s tough to see this holding up for too long unless gold itself makes a bigger move.
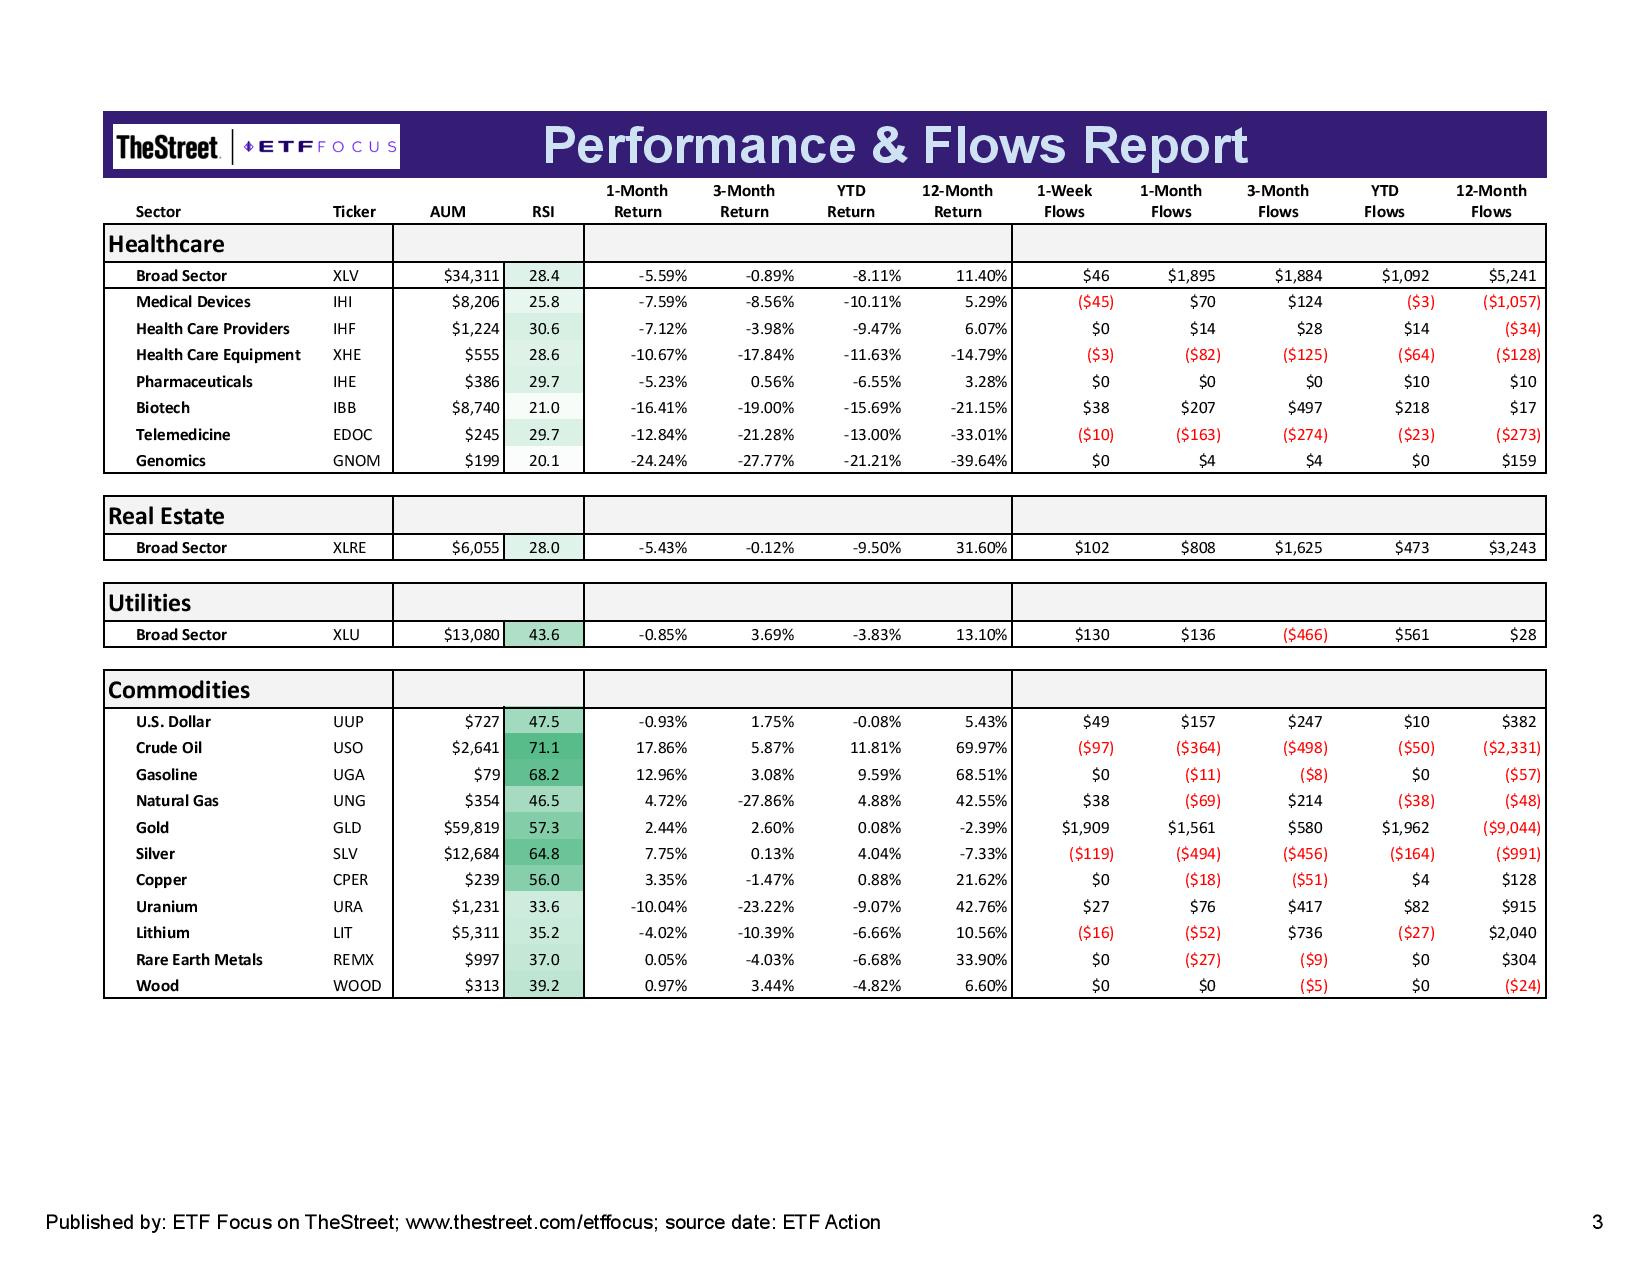
Healthcare and real estate are still looking like they’re in rough shape despite the outperformance of consumer staples and utilities. Healthcare, in particular, has been bouncing around all over the place and is struggling to develop any kind of narrative. The “tech-ier” side of healthcare - equipment, biotech and genomics - continue to show significant weakness.
The commodities story, as it has for a while, revolves around crude oil and metals. Oil is still rising in anticipation of stronger demand later this year and, while an increasing number of folks are talking about $100 a barrel prices coming soon, I’m just not seeing it. I think energy stocks can still be a market leader here, but I think a pause from the recent rally is more likely in the short-term.
Both precious and industrial metals have done OK here. Lumber prices pulled back significantly last week, but I’m not sure if this is the start of a downtrend yet. The dollar looks like it’s finally finding some balance again after the recent pullback of its own.
Read More…
The Narrative For 2022 Is Set, But 2023 Could Be Trouble
Top 7 High Yield Covered Call ETFs For 2022
Top 5 Cloud Computing ETFs For 2022
The ARK ETFs Are Getting Pummeled, But This One Still Looks Interesting
This ETF Is Making QQQ Irrelevant
The Fed Has Been Playing With Fire. Now, It's Getting Burned
Top Performing Dividend ETFs For 2021
Top 7 Dividend ETF Picks For 2022
Questions, Ideas, Thoughts?
Feel free to reach out by replying to this e-mail or commenting below. Your question or idea might be used in a future newsletter!