


Last Week Stunk, But The Markets Don't Look Broken Yet
Last week marked a relatively substantial change in short-term market sentiment for the first time in 2023, but one that I do not view as sustainable in the medium-term.

Hi everyone and welcome back to the ETF Focus Rewind!
If you’re an existing subscriber, it’s great to have you back again! If you’re not or if you’re finding us for the first time, perhaps you’ll consider becoming a regular reader!
Just click the “Subscribe” button below to get the ETF Focus Rewind for free on a weekly basis. We discuss the latest events in the financial markets through the lens of ETFs and how they impact your money!

One other note…
I’m on Instagram now! You can click HERE to follow. It’s a spot where I’m going to be dropping more infographics, stats and visual content. I think you’ll find it useful for more “quick hits” on the latest trends and ideas!
Hope you’ll join me!
Last week marked a relatively substantial change in short-term market sentiment for the first time in 2023, but one that I do not view as sustainable in the medium-term. Even though the S&P 500 was down more than 1% and small-caps fell more than 3%, this looks like a combination of digesting the recent Fed actions as well as a resetting for the next major catalyst to come down the pike. We’ll get some key economic data this week, including the U.S. inflation report for January, but the March Fed meeting is likely the next event that could cause a jolt in the markets.
The January inflation rate is expected to have increased by 0.5% compared to December, but also drop to 6.2% on a year-over-year basis. The Fed has obviously used the inflation numbers as a key input to crafting interest rate policy, but at this point it looks like the path is relatively set. The overall inflation rate is likely to continue dropping throughout 2023 and the Fed probably has two more quarter-point hikes in it before all is said and done. A third may be a possibility, but that’s about the only uncertainty we see ahead right now. It’s a far cry from 2022 when terminal rate expectations were being changed by 50-75 basis points at a time.
Last week, however, was a good reminder (and probably a healthy one) that even the mighty U.S. equity market in 2023 will make periodic pullbacks. Looking at sector momentum and risk measures, this has the look of a short-term pause as opposed to the beginning of a broader reversal. Longer-term, the risk of sliding into both recession and deflation is still very much present, but the latest data suggests that these events may be further out into the future than was expected as recently as a month ago.
If we look at short-term momentum and relative strength indicators, we can see how the composition of market returns is beginning to change.

Even just a week ago, we saw significant strength in the growth themes and sectors - tech, consumer discretionary, high beta and small-caps - but that trend is clearly beginning to fade. Tech is still maintaining its strength, but the other groups are getting weaker, which means tech’s turn to fade is probably inevitable.
On the other side of the graphic, we can see defensive sectors - utilities, healthcare and consumer staples - starting to pick up steam. Industrials have generally done a pretty good job of being a signal of overall cyclical sentiment, and that has been improving as well, but most other cyclical areas of the economy, especially the commodities side, remain weak.
Sector momentum, in isolation, could be taken as a sign that markets are weakening, but I’m just not seeing that looking at a broader set of indicators. The VVIX/VIX ratio measures the volatility of the VIX index against the volatility of the S&P 500. Generally speaking, when the VVIX/VIX ratio is rising, it’s a bullish signal, and vice versa.
The market trend over the past 3-4 months is still pretty clear.

The ratio ticked down modestly last week, but the longer-term uptrend is still in place. The fact that it took out the recent August high is encouraging and it’s sitting at its highest level since April. This shows me that the overall positive sentiment that’s existed since November isn’t broken yet and could still carry the markets higher.
How about a few other indicators?
The VIX is at 20, still modest and not yet indicating rising risks. High yield bond spreads are still at historic lows and nowhere near indicating a substantial risk build-up in bonds. Treasuries usually start spiking relative to stocks when conditions worsen. We have yet to see that too.
Overall, we’re seeing some shift over to defensive assets for now, but the medium- and longer-term trends still remain in place. The latest data suggests that recession is still a ways off. My base case remains that stocks are probably in a good place until the March Fed meeting, but what Powell says there will drive the market narrative into the 2nd quarter.
ETFs in Focus
Here’s a look at the weekly net flows/RSI matrix, where I try to get a sense of what the markets are doing relative to what investors are doing to see if there are disconnects.
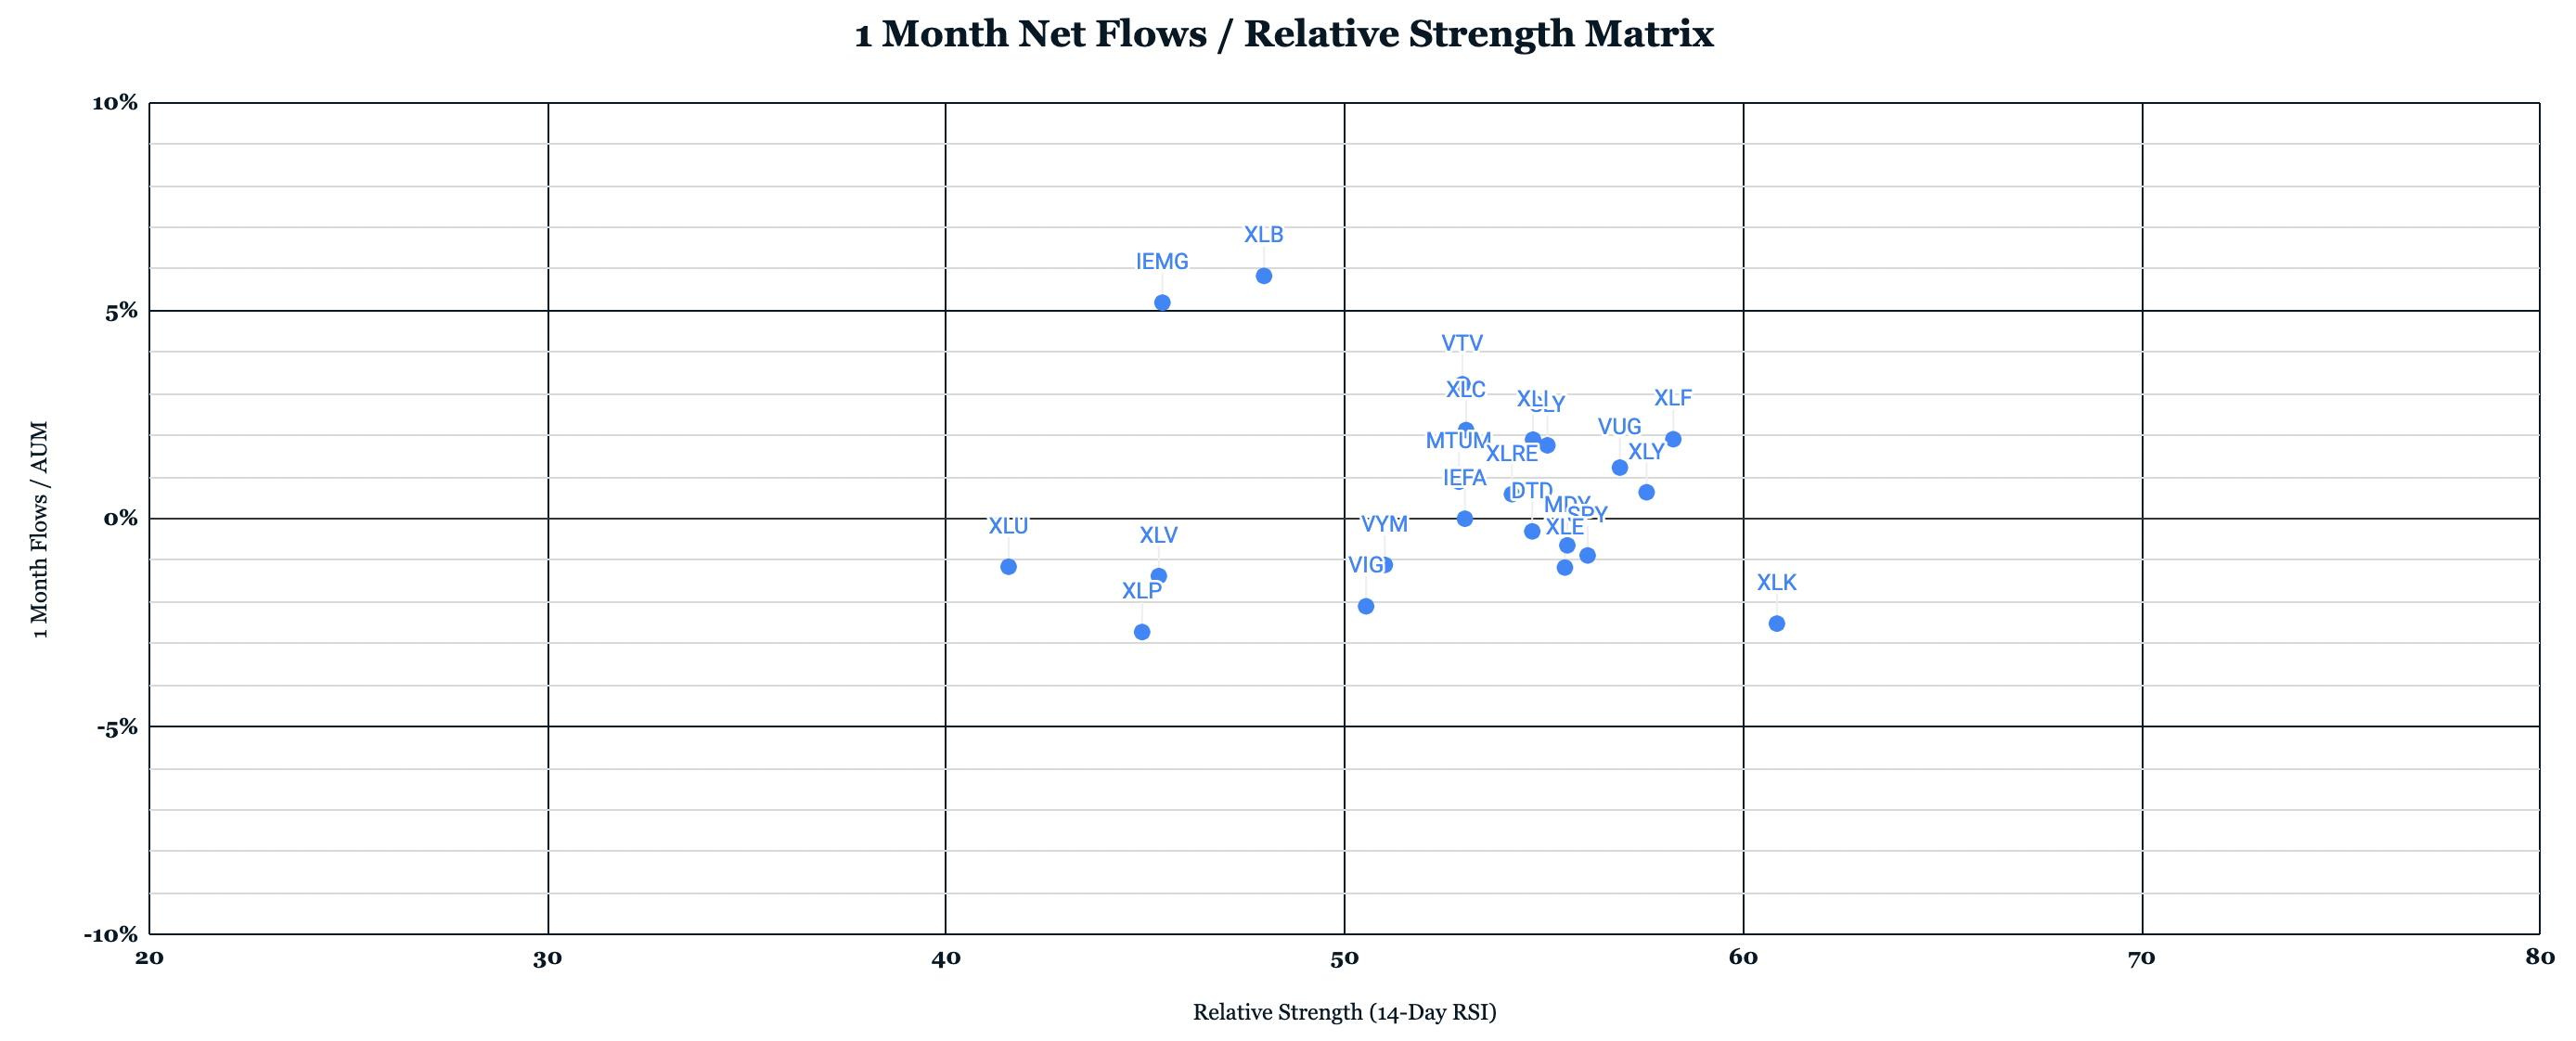
Note: Most ETFs will fall above the 0% flows/AUM line because, well, ETFs take in hundreds of billions of dollar annually. So I’m looking at 1-month flows to focus on the short-term (1-week flows are too choppy to have high confidence in the results). Upper-left quadrant would identify ETFs that are performing poorly but are seeing investor money moving in. The lower-right quadrant would be ETFs that are performing well, but seeing money leaving. Both could provide contrarian opportunities. I wouldn’t call them buys or sells. Just more of a way of potentially identifying trends.
Most ETFs are getting bunched up in the middle of this graph, which means that the markets are relatively neutral at the moment and flows, for the most part, aren’t seeing significant shifts either way. This lack of volatility one way or the other could be supportive of a general uptrend in asset prices, but I think it’s a little too early to tell.
There are a couple of outliers here. Tech (XLK) is one I’m finding interesting because it spent years as an investor favorite that consistently took in money despite the results. Now, it’s one of the best-performing sectors of 2023, yet it’s still seeing outflows. We’re seeing a similar outflow trend in energy (XLE) ETFs overall, but that’s less surprising given the volatility of returns in recent weeks.
Materials (XLB) is the other one. Performance has been very middling, yet it’s seen a big boost in net flows. We could be seeing some spillover from the gains being seen in the commodities market.
Instagram Post of the Week
Last week, I put up a post that profiled 4 different S&P 500 ETFs side-by-side that all use different weighting and/or selection methodologies. The traditional cap-weighting (SPY), equal-weighting (RSP), reverse cap-weighting (YPS) and ESG (SNPE) versions all have very different compositions and return profiles.

Overbought & Oversold
Overbought: NGE, GREK, QYLD
Near Overbought: VGT, FLOT, DBA, ITA, EWI, BDRY
Near Oversold: BND, GOVT, LQD, EMB, PALL, SLV, GDX, TUR, UNG, INDA
Oversold: PPLT
Note: Oversold/Overbought developed using a combination of RSI and Longbow dashboard.