


Junk Bonds Begin Flashing Major Warning Sign
This is perhaps the biggest signal yet that 1) investors are getting more defensive and 2) this downside move might not nearly be over.


Saying that there’s an asset class flashing a warning sign after some equity sectors are already down 20-30% or more is a little like saying you should try to swerve out of the way after the car accident has already happened. It seems a little obvious, but I also think there are signals that still aren’t nearly where they should be when looking at previous market bottoms.
The one that I think that is flashing the biggest warning sign right now (and the one that could be signaling that there’s more downside ahead) is the high yield spread. Let me explain why.
I probably don’t need to tell you that up until around 6-8 months ago, we were in a prolonged period of historically low interest rates. That didn’t really change much until December of last year. That’s when the Fed signaled that the launch of a new monetary tightening cycle was imminent and that rate hikes would begin (about a year too late if you ask me but that’s a story for another time).
Since then, interest rates have been steadily rising and that’s sent bonds into the tank. You’d think that junk bonds might fall more than Treasuries in this environment, but that hasn’t been the case. They’ve moved down pretty much in lock step, which is a product of this being a Fed-induced yield curve shift.
Here’s where yields on junk bonds are right now.

The blue line is the yield itself. The orange line is the high yield spread. This is essentially the risk premium that bond investors are demanding for owning junk bonds above that of Treasuries.
While nominal yields have been climbing since the latter part of 2021, high yield spreads haven’t really been on the move since April. When spreads remain constant, that means the whole yield curve across credit quality is moving. When spreads expand, that means investors are taking risk off the table.
In just two months, the high yield spread has gone from 3.5% to nearly 5%. This is perhaps the biggest signal yet that 1) investors are getting more defensive and 2) this downside move might not nearly be over.
Let’s take a look at that high yield spread historically and how it’s correlated to moves in the S&P 500.
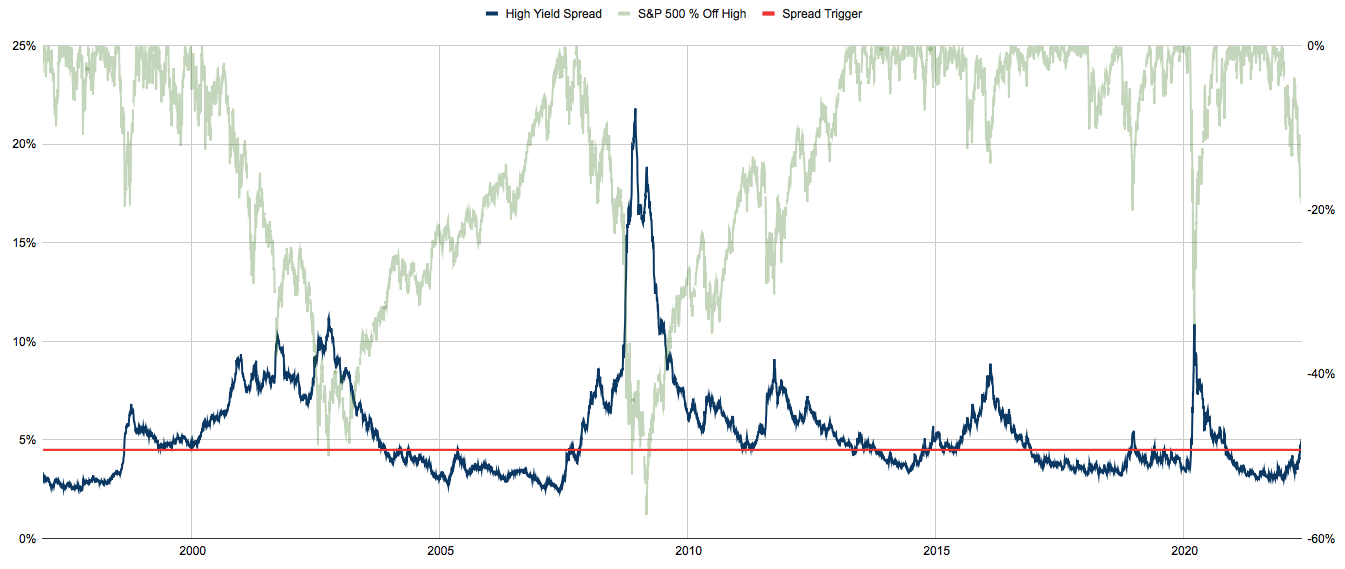
Not surprisingly, high yield spreads and stocks are very inversely correlated. Generally speaking, the higher the spread goes, the further the S&P 500 falls.
The red line on the chart is a “trigger” level I’ve drawn where the high yield spread is 4.5%. Why is this level important? Because, historically speaking, whenever the spread has broken above this level, it’s ended up going much higher.
The best case scenario over the past quarter century has been the 2018 mini-bear market. In that instance, the high yield spread only got up to about 5.5% before retreating. The S&P 500 fell by about 20%, but quickly rebounded once the Fed pivoted.
In every other instance - the tech bubble, the financial crisis, the 2012 Greek debt crisis, the 2016 junk bond crisis and the COVID recession, the high yield spread hit at least 9%. In three cases, it exceeded 10%. During the financial crisis, it was more than 20%.
I point this out because look where we are today. The S&P 500 briefly hit 20% off of its all-time high and the high yield spread hasn’t even hit 5% yet! The U.S. economy is still in decent shape for now, which is probably a big part of the reason why this number hasn’t moved higher. Some investors are still holding on to hope that the Fed can soft-land this thing and avoid a recession.
I’m not in this camp. The Fed has shown no real ability to steer this ship gently in the past. Any tightening cycle has been met with an economic downturn at the end of it. With the housing market only recently peaking, inflation above 8% and the Fed expected to raise rates at least another 200 basis points from here, all signs point to a recession ahead.
I’m betting that the high yield spread heads towards at least 8% again. If that happens, another 10-15% downside wouldn’t be surprising.
The only thing that I think establishes a real bottom in this market is a dovish pivot from the Fed. Whether that’s a result of inflation coming down and the Fed taking its foot off the gas or the Fed simply tries to stop the losses in risk assets, I’m not sure. But that would be the catalyst. It happened in 2018, it happened in 2020 and would probably need to happen again.
ETF Sector Breakdown
With that being said, let’s look at the markets and some ETFs.
Energy continues its months-long streak of market leadership. Crude prices, which looked like they were starting to come, reversed course and helped push stock prices in this sector higher again. Materials stocks, which had also been outperforming, look like they’re starting to run out of gas here.
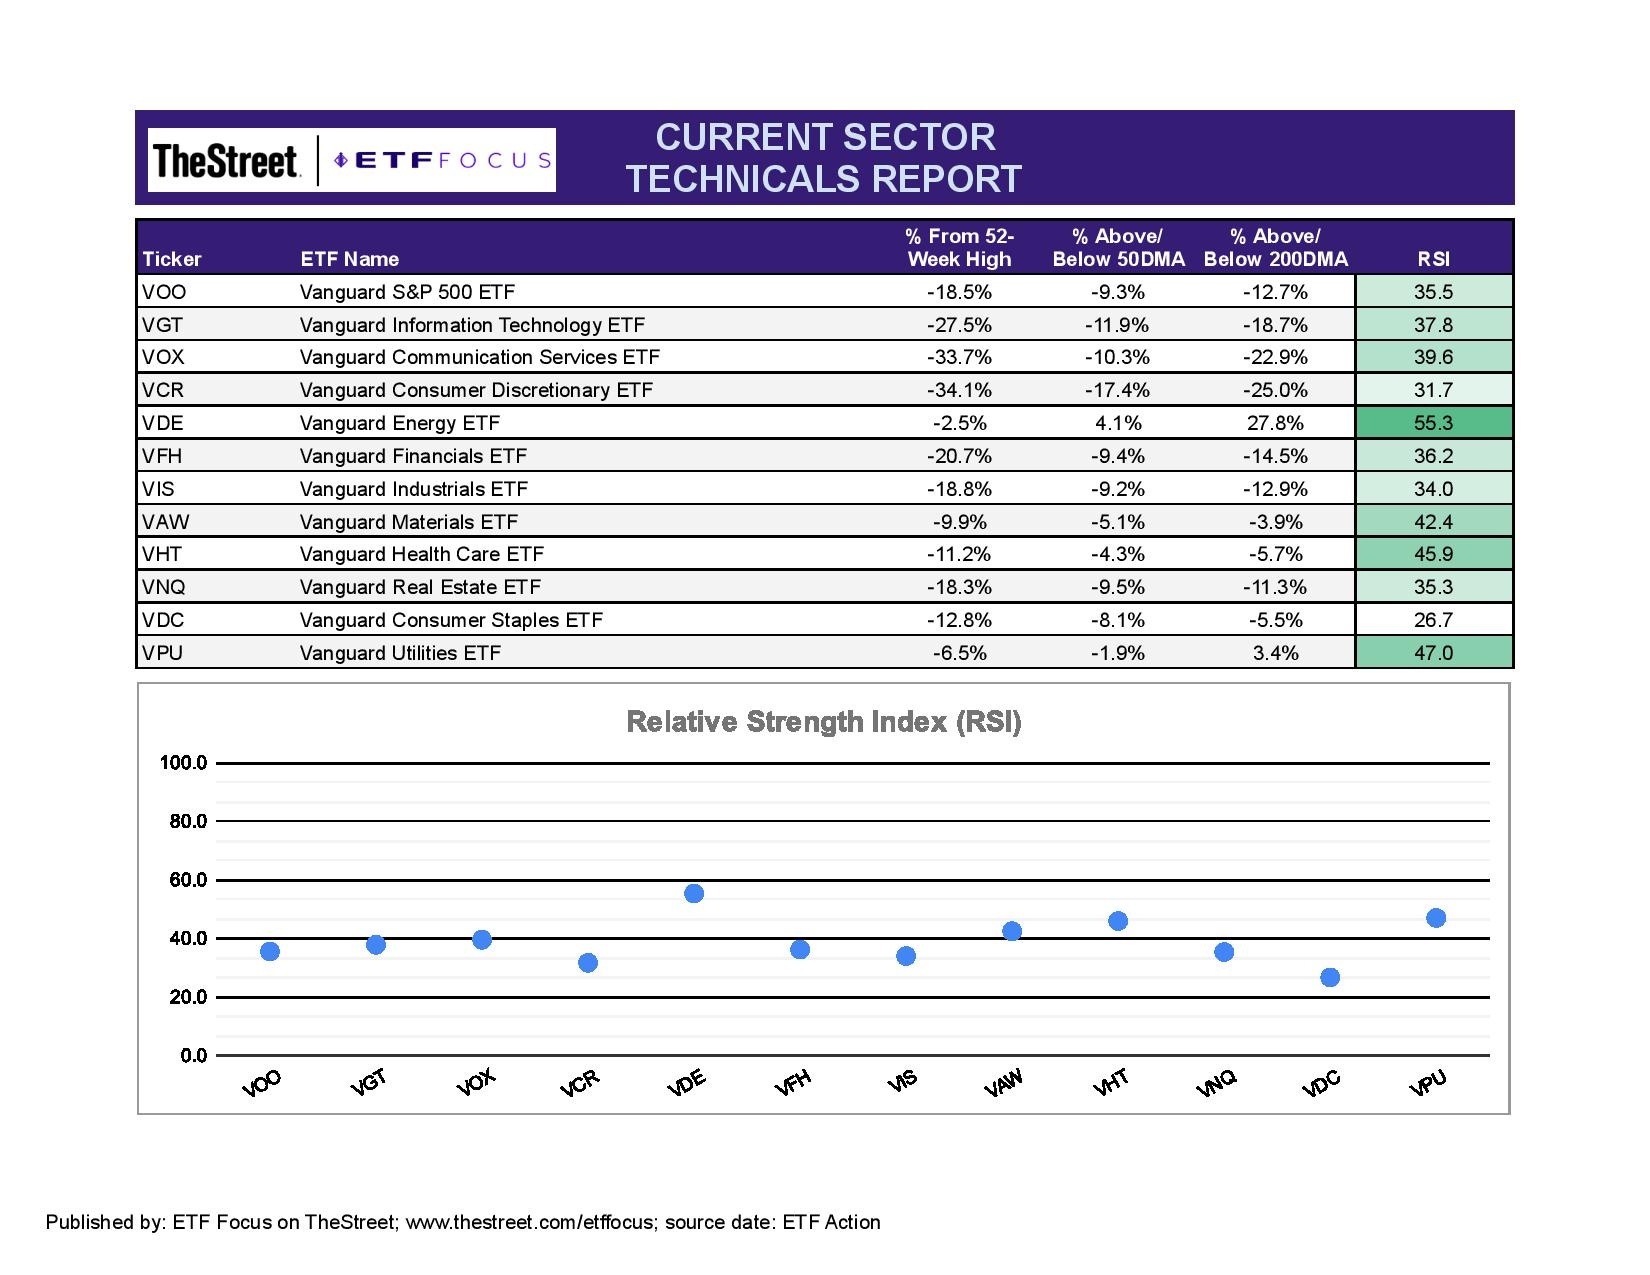
The most interesting movement has come from the defensive sectors. Consumer staples, which had been one of the best performing sectors in this decline, got hammered by the disappointing earnings results from the retailers and slid 7% on the week. It’s been replaced by healthcare, which has strung together a couple relatively good weeks, while utilities remains ahead of the pack.
Growth has turned into a bit of a mixed bag. Communication services had actually begun outperforming again after months of misery. Consumer discretionary has easily become the most disappointing sector on the heels of those retail earnings reports.
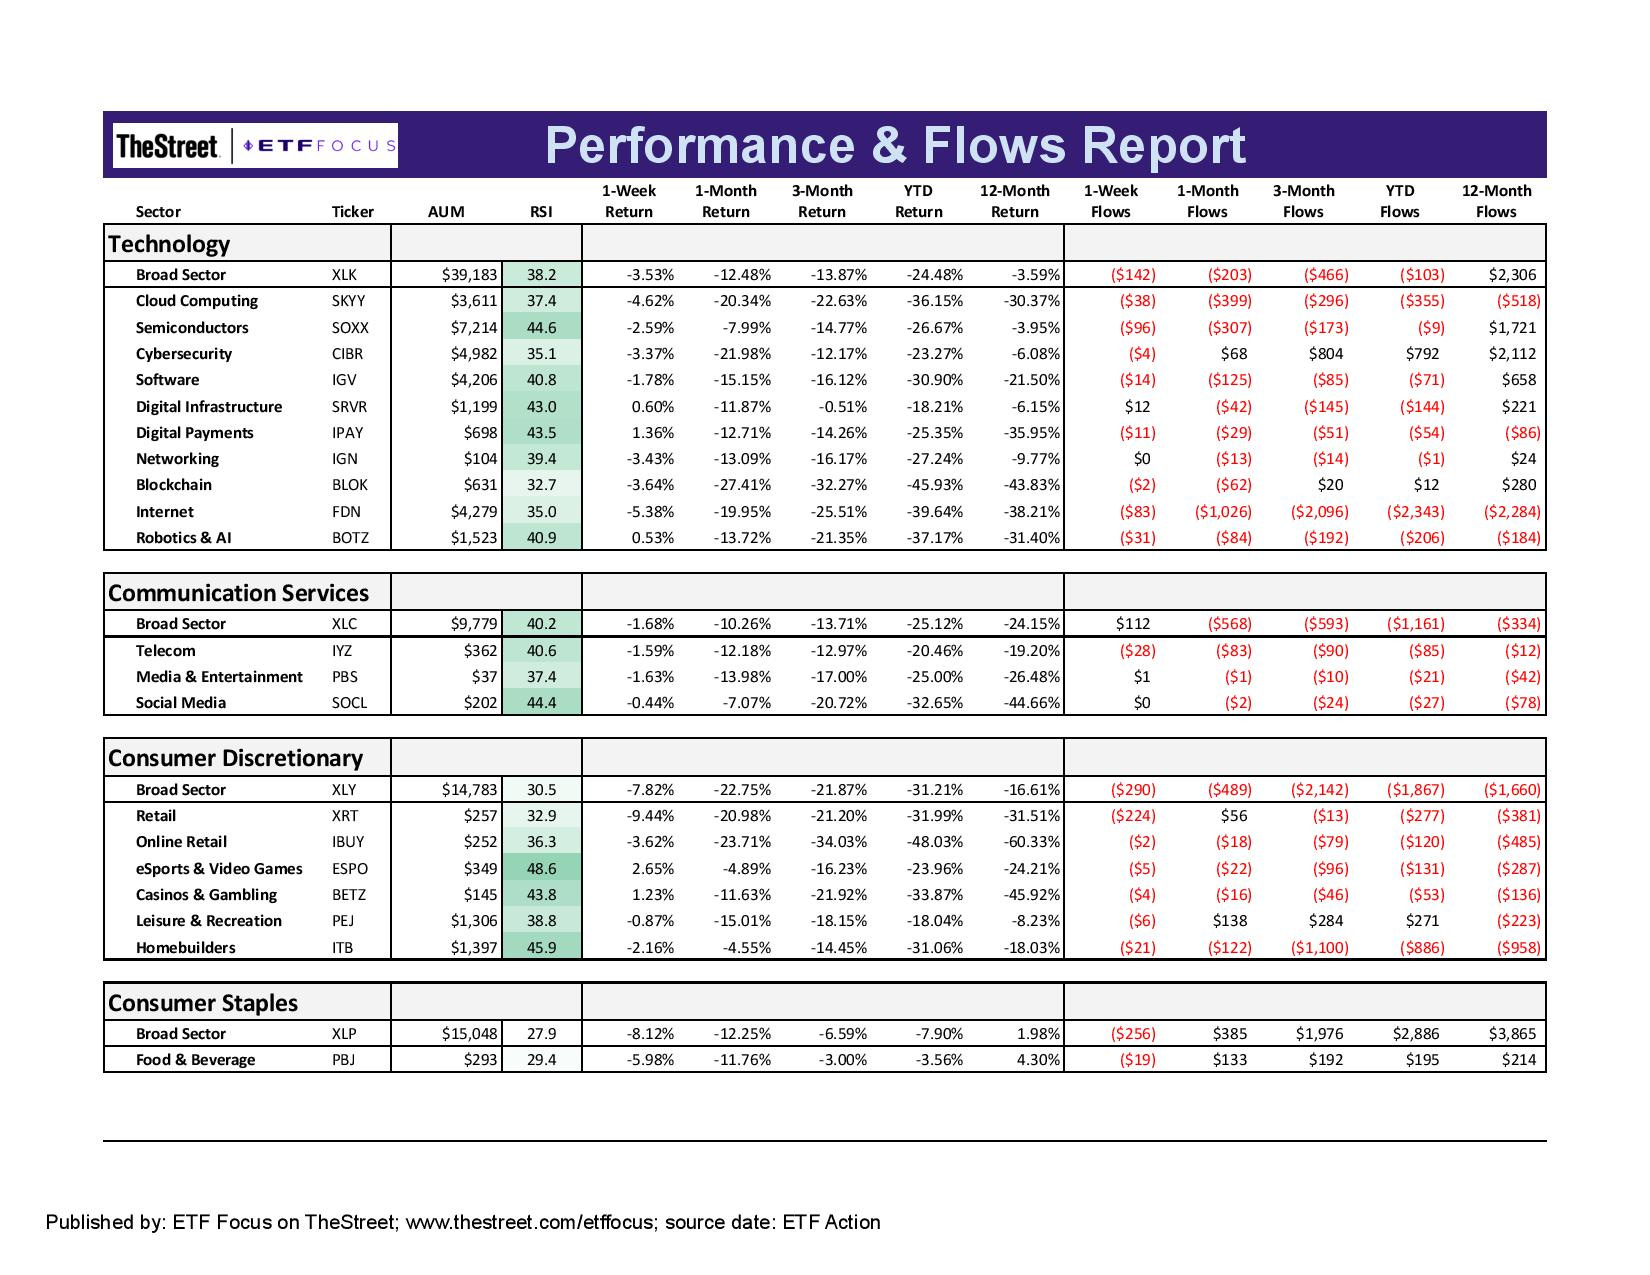
There are no real standouts among any of the growth subsectors at the moment. Retail obviously got the most attention last week and has extended its disappointing run to more than a year back. Online retail, which had done so well early on in the pandemic, has done nearly a full round trip and is essentially back to where it was pre-pandemic. Some of the other discretionary groups, including leisure, homebuilders and casinos, actually had a relatively better week, but that was mostly masked by retail. Tech simply can’t get any momentum going and has been a laggard ever since the Fed signaled its tightening cycle last December.
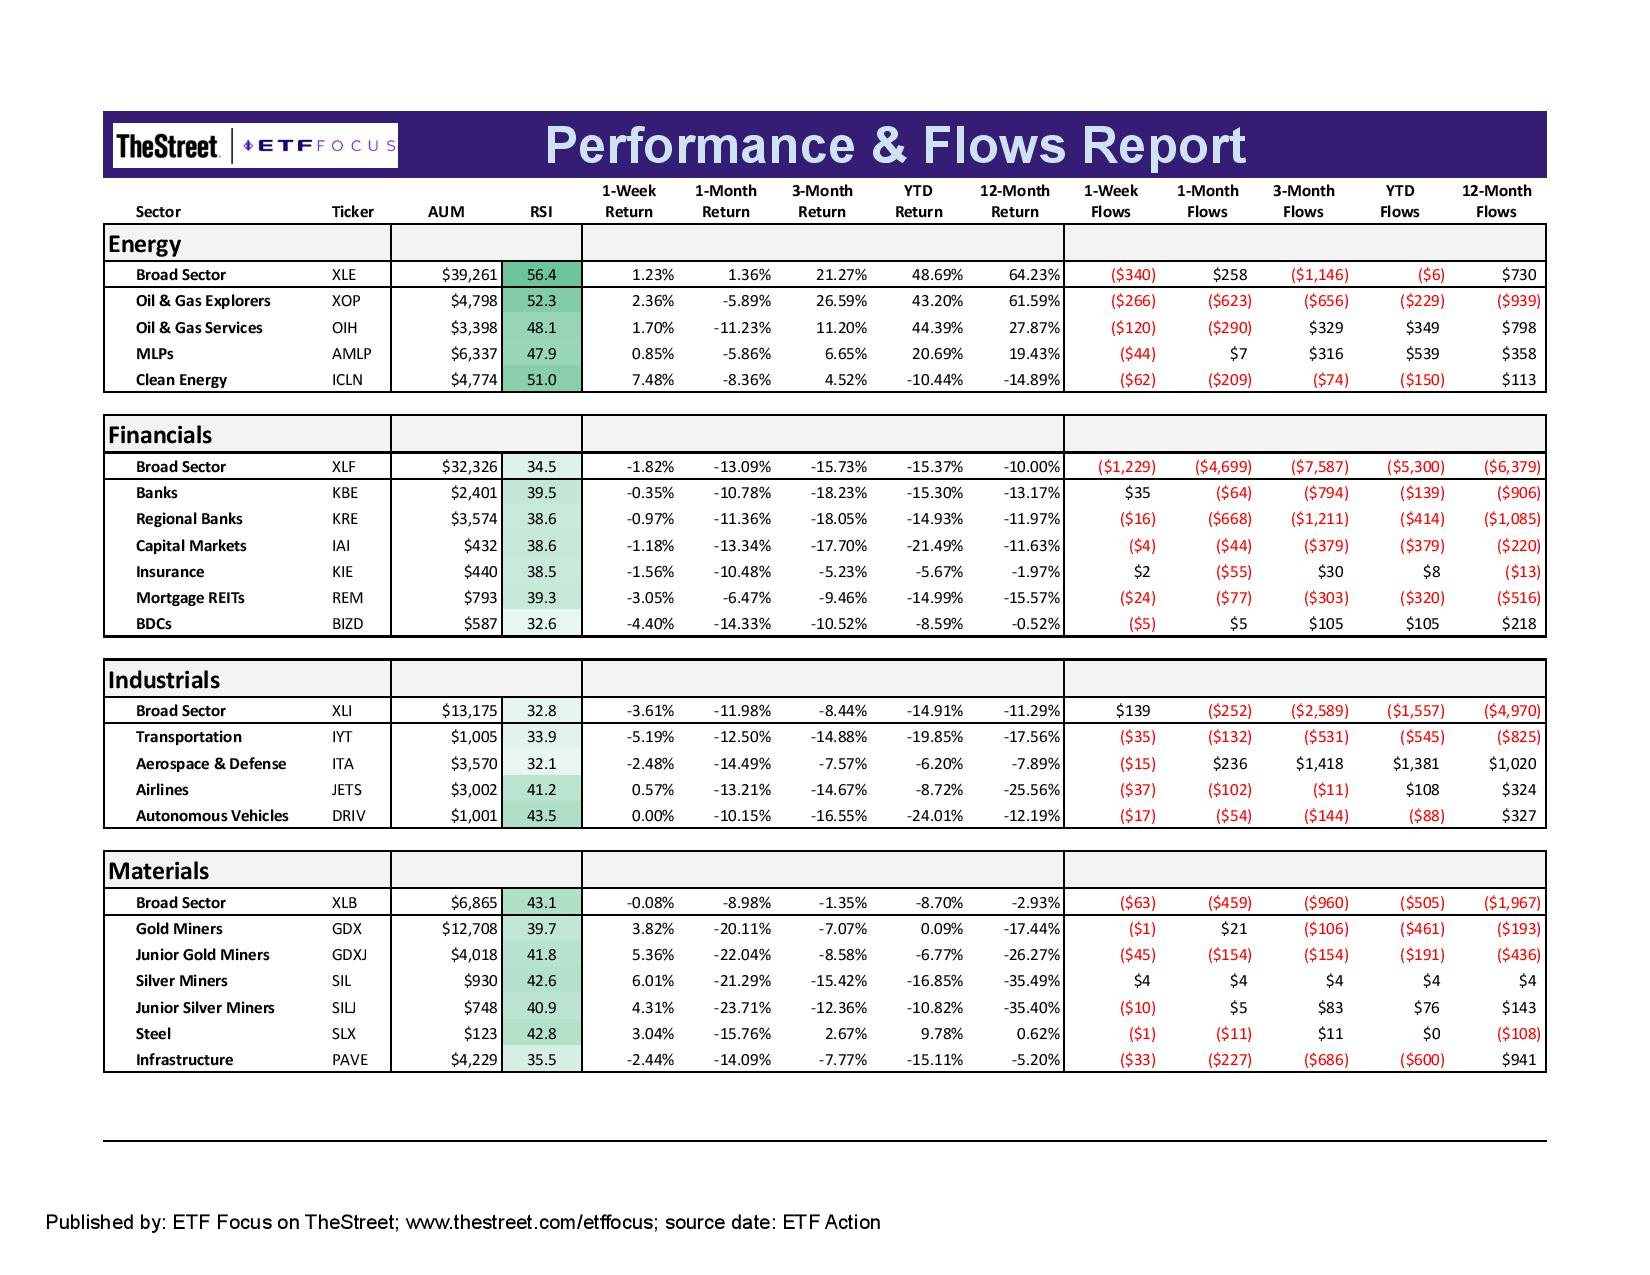
For the first time in a while, clean energy moved higher along with the rest of the sector. Nothing else within cycles is standing out at the moment. The most notable thing I’m seeing here is the sea of red across the right side of this graphic. Nearly every area of growth and cyclicals is seeing outflows at the moment. This is quite the reversal of the years-long trend we’ve seen in ETFs where hundreds of billions of dollars have flowed in regardless of market performance. I think some of that money hung around with Treasury prices falling nearly as much as equities. Now that Treasuries are gaining some stability again, we could be seeing investors finally beginning to rotate out of equities altogether now that there’s a palatable alternative.
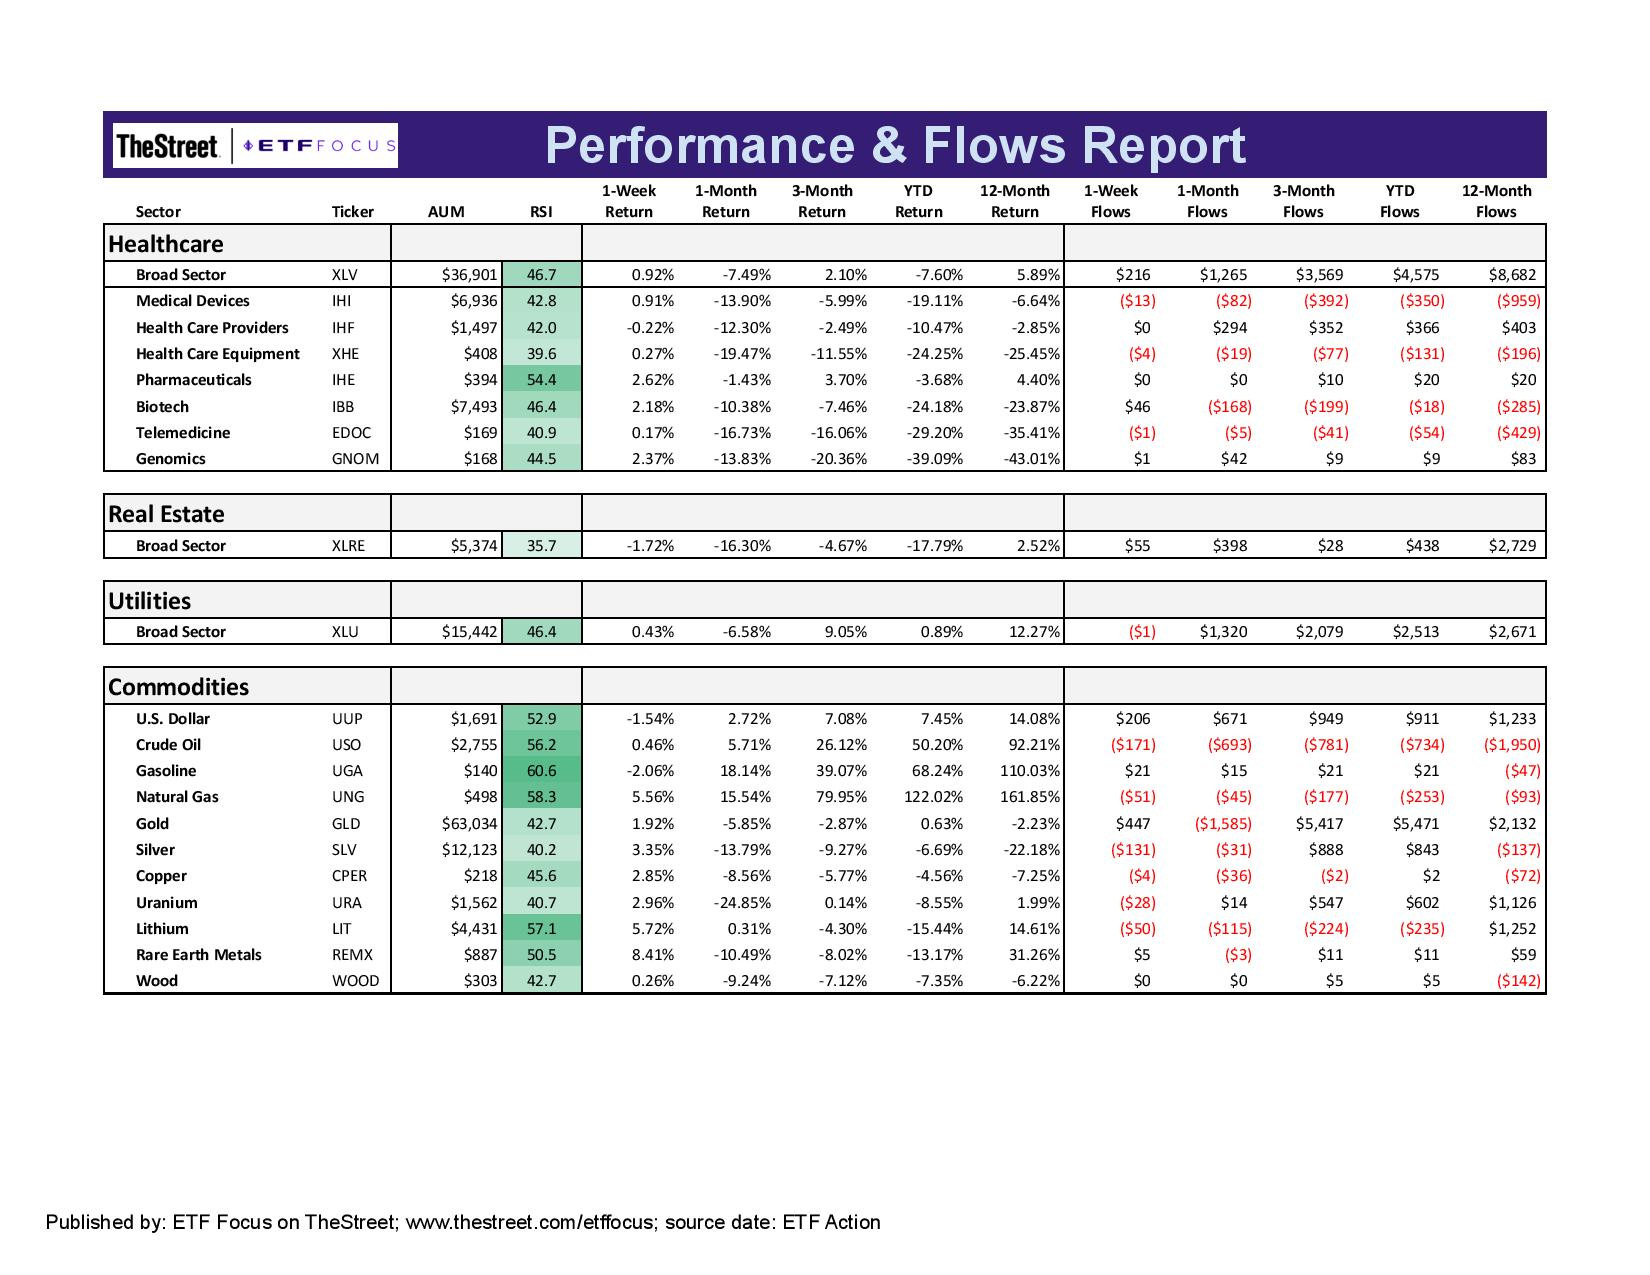
Healthcare has been a little choppy for a while, but it enjoyed a nice week. It was one of the few areas of the market that actually experienced some gains. Utilities held strong as they have for several months now, but real estate is still figuring out which direction it wants to go. The biggest mover here is the dollar, which finally took a breather from its sharp rally and lost just under 2%. The greenback has been pretty steadily correlated with U.S. stocks recently and I’d expect any potential oversold bounce in stocks to be met with dollar weakness.
Questions, Ideas, Thoughts?
Feel free to reach out by replying to this e-mail or commenting below. Your question or idea might be used in a future newsletter!