


Investors Are Pushing Hard Into Cash. Should You Be Doing The Same?
This is perhaps the best environment in decades for taking the yield offered by cash and walking away.

Hi everyone and welcome back to the ETF Focus Rewind!
If you’re an existing subscriber, it’s great to have you back again! If you’re not or if you’re finding us for the first time, perhaps you’ll consider becoming a regular reader!
Just click the “Subscribe” button below to get the ETF Focus Rewind for free on a weekly basis. We discuss the latest events in the financial markets through the lens of ETFs and how they impact your money!

One other note…
I’m on Instagram now! You can click HERE to follow. It’s a spot where I’m going to be dropping more infographics, stats and visual content. I think you’ll find it useful for more “quick hits” on the latest trends and ideas!
Hope you’ll join me!
Investing in either stocks or bonds over the past six months has undoubtedly been a roller coaster. It’s literally been nothing but up-down-up-down-up and now back to down again with no real progress made.

Things looked good in January when growth stocks rebounded, but turned south when a series of higher than expected inflation readings forced the Treasury yield to again readjust higher and send stocks lower. It’s a familiar theme that’s been playing out for nearly 15 months and may not be done for several more.
The markets have now almost fully priced in 3 more quarter-point rate hikes by this summer and a 40% chance of a fourth. The Fed Funds rate and, by extension, rates on cash equivalents such as T-bills and money markets are going above 5% soon with a good chance that they’ll hit 5.5% within the next two quarters.
That makes the yields on short-term fixed income instruments very attractive. This is especially the case given that they come with almost no risk and take the concern about where the markets are heading next out of the equation. Investors are seeing the same thing and beginning to respond.
Let’s take a look at some ETF net flow numbers to see how the money is moving around (all numbers courtesy of ETF Action).
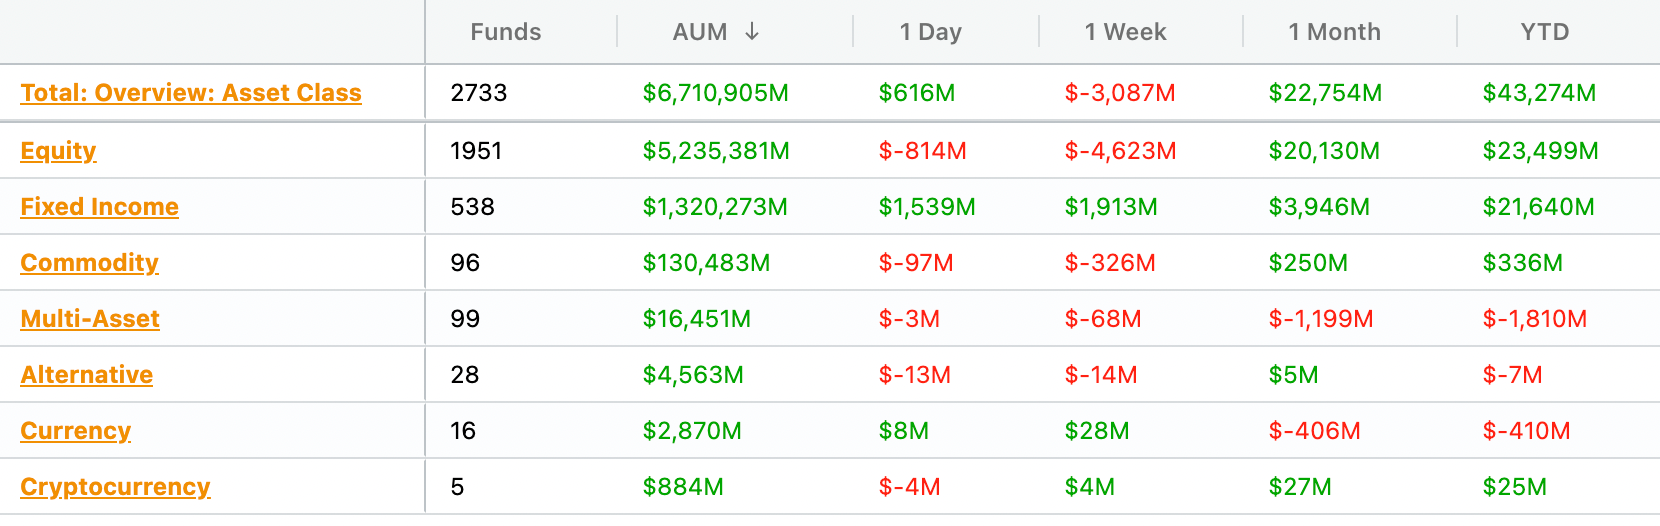
Overall, more than $43 billion in new money has been added to ETFs. This isn’t surprising since ETFs have been attracting hundreds of billions of dollars annually for the past few years. The split between equity and fixed income, however, is nearly even despite stock funds having four times the assets. On a short-term basis, those numbers are pretty volatile and reflect the volatility of which asset class is in favor at any given moment. The bottom line is investors are moving back into fixed income at a proportionally higher rate.
If we dig further down into bond ETF flows, the flight to safety trade becomes more apparent.

Over the past month, there’s been a $9.3 billion inflow into Treasuries and an almost identical outflow from corporate bonds (the “multi-sector” flows are from things like total bond market ETF; think the iShares Core U.S. Aggregate Bond ETF (AGG) and the Vanguard Total Bond Market ETF (BND)). Corporate bonds don’t have a lot of credit risk priced in at the moment, so the overall risk level isn’t that different from Treasuries, but the optics of a huge shift into government bonds is a sure sign that investors want to take risk off the table. The flows over the day and the week demonstrate a steady flow as well.
Let’s dig down one more level into the duration level.

Granted, it’s a relatively short time frame, but over the past week, the vast majority of money moving into fixed income is going to ultra-short term bonds. Again, that’s T-bills and other notes with a maturity of less than a year. It is, however, coincident with the time frame that we’ve seen with the release of the PCE index and other measures that are driving the yield curve higher and forcing the markets to reassess their expectations of rates going forward. This looks very much like a risk-off move.
And it makes sense too. You could question whether shifting to cash made sense when rates were at 0%. Now that nearly risk-free yields of 4-5% are available, it’s a legitimate alternative to risk assets. As I’ve said before, would you prefer to sit the next year out altogether and collect a 5% yield or take your chances in stocks or bonds and hope you can beat that heading into a likely recessionary environment? A lot of people would choose the former and they’d be justified in doing so.
The supporting argument is that there isn’t nearly enough of a financial incentive to take on that risk right now. The implied equity risk premium is at its lowest level since the early 2000s.
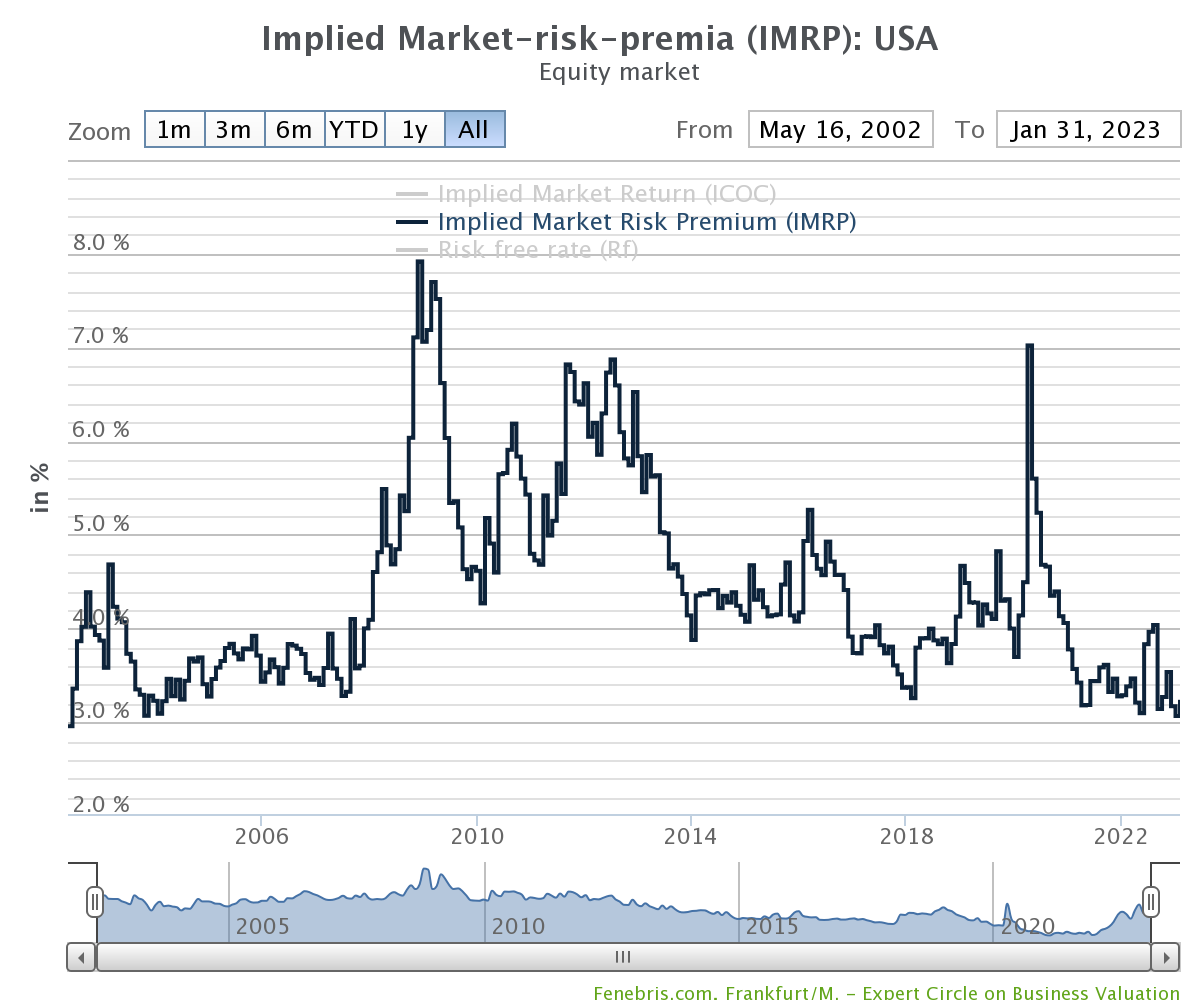
Despite conditions potentially looking quite negative over the next 12 months, investors aren’t asking for a lot in exchange for all that risk. This is perhaps the best environment in decades for taking the yield offered by cash and walking away. A lot of investors are already taking advantage of it. Perhaps you should consider it too.
ETFs in Focus
Here’s a look at the weekly net flows/RSI matrix, where I try to get a sense of what the markets are doing relative to what investors are doing to see if there are disconnects.

Note: Most ETFs will fall above the 0% flows/AUM line because, well, ETFs take in hundreds of billions of dollar annually. So I’m looking at 1-month flows to focus on the short-term (1-week flows are too choppy to have high confidence in the results). Upper-left quadrant would identify ETFs that are performing poorly but are seeing investor money moving in. The lower-right quadrant would be ETFs that are performing well, but seeing money leaving. Both could provide contrarian opportunities. I wouldn’t call them buys or sells. Just more of a way of potentially identifying trends.
I added a few bond ETFs to the matrix this. The main purpose is to show the level of interest in Treasury bills (SHV) at the moment. Not only have they been performing quite well, a lot of investors are pushing their money into them. In isolation, this suggests investors taking some risk off the table, but the Treasury market has been choppy this year. Long-term Treasuries (TLT) have also been taking in money, but performance there has been much more muted.
Emerging markets are starting to slow down, both in terms of performance and flows. The flow numbers recently are actually flat, not negative, so there’s still something of an undercurrent there. Real estate and utilities are among the big net outflow sectors, despite the latter doing comparatively better in recent weeks. Tech, somewhat curiously, continues to see negative flows despite being one of the best performing sectors of 2023.
Instagram Post of the Week
Last week, I put up a post that used several of the top dividend ETFs to identify the handful of dividend growth stocks that met the criteria for several different strategies. Each of the five dividend ETFs used (VIG, NOBL, DGRO, SCHD, DGRW) use some type of dividend growth strategy, several adding screens for quality and/or yield on top of it.
In the end, only 7 dividend growth stocks appeared in all of these ETFs.

Overbought & Oversold
Overbought: UUP, BDRY
Near Overbought: SHV, BIL, TFLO
Near Oversold: EEM, GLD, PPLT, EWA, KWEB, IEI, SLQD, SHY, WOOD, FXE, IHE, XLV, XTL, SPYD, IBUY, ICLN, QYLD
Oversold: THD, FM, EWH, GDX, SLV, INDA, IVOL, IBB, MUB, FXI, CYB
Note: Oversold/Overbought developed using a combination of RSI and Longbow dashboard.